Waihopai Valley
Appearance
The Waihopai Valley branches off the Wairau Valley.
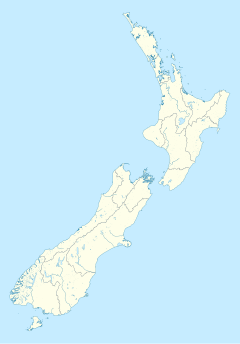
Waihopai Valley is an area near Blenheim in the Marlborough region of the South Island of New Zealand. The Waihopai River drains the area.
The Government Communications Security Bureau operates what it describes as a satellite communications monitoring facility in the Waihopai Valley, which it calls GCSB Waihopai. It has been identified as being a part of ECHELON, the worldwide network of signals interception facilities run by the UKUSA consortium of intelligence agencies.
The lower Waihopai, as it runs into the Wairau Valley, has a number of vineyards.[1] From 1925 to 1927 small hydroelectric power station was built in the valley.[2] It is now operated by TrustPower.
Climate
[edit]| Climate data for Waihopai Power Station (1971–2000 normals, extremes 1962–1987) | |||||||||||||
|---|---|---|---|---|---|---|---|---|---|---|---|---|---|
| Month | Jan | Feb | Mar | Apr | May | Jun | Jul | Aug | Sep | Oct | Nov | Dec | Year |
| Record high °C (°F) | 35.0 (95.0) |
38.5 (101.3) |
31.7 (89.1) |
28.1 (82.6) |
22.4 (72.3) |
21.4 (70.5) |
19.1 (66.4) |
20.3 (68.5) |
26.5 (79.7) |
29.0 (84.2) |
29.5 (85.1) |
35.0 (95.0) |
38.5 (101.3) |
| Mean maximum °C (°F) | 31.5 (88.7) |
30.9 (87.6) |
27.6 (81.7) |
24.0 (75.2) |
19.3 (66.7) |
16.8 (62.2) |
15.4 (59.7) |
17.1 (62.8) |
20.5 (68.9) |
23.4 (74.1) |
26.1 (79.0) |
28.8 (83.8) |
32.6 (90.7) |
| Mean daily maximum °C (°F) | 23.7 (74.7) |
23.6 (74.5) |
21.1 (70.0) |
17.8 (64.0) |
14.4 (57.9) |
11.5 (52.7) |
11.0 (51.8) |
12.4 (54.3) |
14.7 (58.5) |
17.1 (62.8) |
19.0 (66.2) |
21.5 (70.7) |
17.3 (63.2) |
| Daily mean °C (°F) | 17.4 (63.3) |
17.3 (63.1) |
15.2 (59.4) |
12.2 (54.0) |
9.2 (48.6) |
6.6 (43.9) |
6.0 (42.8) |
7.1 (44.8) |
9.4 (48.9) |
11.6 (52.9) |
13.5 (56.3) |
15.6 (60.1) |
11.8 (53.2) |
| Mean daily minimum °C (°F) | 11.2 (52.2) |
11.0 (51.8) |
9.3 (48.7) |
6.7 (44.1) |
4.0 (39.2) |
1.7 (35.1) |
1.0 (33.8) |
1.8 (35.2) |
4.1 (39.4) |
6.2 (43.2) |
8.0 (46.4) |
9.7 (49.5) |
6.2 (43.2) |
| Mean minimum °C (°F) | 5.0 (41.0) |
5.3 (41.5) |
3.4 (38.1) |
1.3 (34.3) |
−1.2 (29.8) |
−2.7 (27.1) |
−4.0 (24.8) |
−2.9 (26.8) |
−1.2 (29.8) |
0.4 (32.7) |
2.4 (36.3) |
4.1 (39.4) |
−4.6 (23.7) |
| Record low °C (°F) | 2.5 (36.5) |
1.3 (34.3) |
0.3 (32.5) |
−2.2 (28.0) |
−4.2 (24.4) |
−6.0 (21.2) |
−8.2 (17.2) |
−5.5 (22.1) |
−6.7 (19.9) |
−2.3 (27.9) |
−1.0 (30.2) |
−0.2 (31.6) |
−8.2 (17.2) |
| Average rainfall mm (inches) | 74.7 (2.94) |
45.7 (1.80) |
61.7 (2.43) |
84.7 (3.33) |
65.5 (2.58) |
86.8 (3.42) |
74.6 (2.94) |
79.4 (3.13) |
71.6 (2.82) |
99.3 (3.91) |
57.5 (2.26) |
69.9 (2.75) |
871.4 (34.31) |
| Source: NIWA[3] | |||||||||||||
References
[edit]- ^ One example is Spy Valley Archived 2024-12-08 at the Wayback Machine.
- ^ "IPENZ Engineering Heritage - Waihopai Dam". IPENZ. Archived from the original on 9 February 2013. Retrieved 17 January 2013.
- ^ "CliFlo – National Climate Database : Waihopai Power Stn". NIWA. Archived from the original on 27 November 2015. Retrieved 15 Sep 2024.

